About

I am a data scientist with a strong skill in Python, R, fluent in Russian, English and a dash of French. My interests lies in turning data into actionable insights. Using statistics, machine learning, and NLP, I can create solutions that make a real-world impact. Whether solo or in a team, I focus on delivering practical and meaningful results. Off-duty, I'm an outdoor enthusiast—think snowboarding and trekking. But water sports? Not my thing.
For more, download my CV ↓
CUSTOMER BEHAVIOR MODELING

Customer Analytics / Churn and Retention Analysis
This project utilizes free customer data from Kaggle to explore, predict, and visualize customer behavior.
The main goal is to understand churn patterns, segment customers using behavioral metrics, and communicate insights through interactive Power BI dashboards, along with my thought process behind every decision and model used.
Our data from Kaggle was relatively clean, requiring minimal preprocessing.
Males represent approximately 46.64% of the dataset, with 38.58% of them churning. In comparison, 18,911 out of 34,353 females churned.
I engineered new features to enhance the analysis:
- Engagement Ratio: Usage frequency divided by tenure.
- Age Groups: Customers grouped by age ranges.
- New_Customers: Customers with less than 6 years of tenure.
- Frequent_Caller: Based on the assumption that frequent support calls may be related to churn.
- Payment_Issue: Derived from the "Payment Delay" variable, assuming customers with delays may be at risk due to financial constraints or contract neglect.
For encoding:
- OrdinalEncoder was used for categorical variables with an inherent order.
- LabelEncoder was used for nominal variables such as gender.
The dataset was balanced and did not require SMOTE or other resampling techniques.
A major goal was to evaluate various classification models for churn prediction. The best model was:
- Random Forest Classifier with an accuracy of 0.99844 and an F1 score of 1.0.
- This slightly outperformed Gradient Boosting by 0.001.
- KNN, SVM, and Logistic Regression also performed reasonably well.
Customer Segmentation:
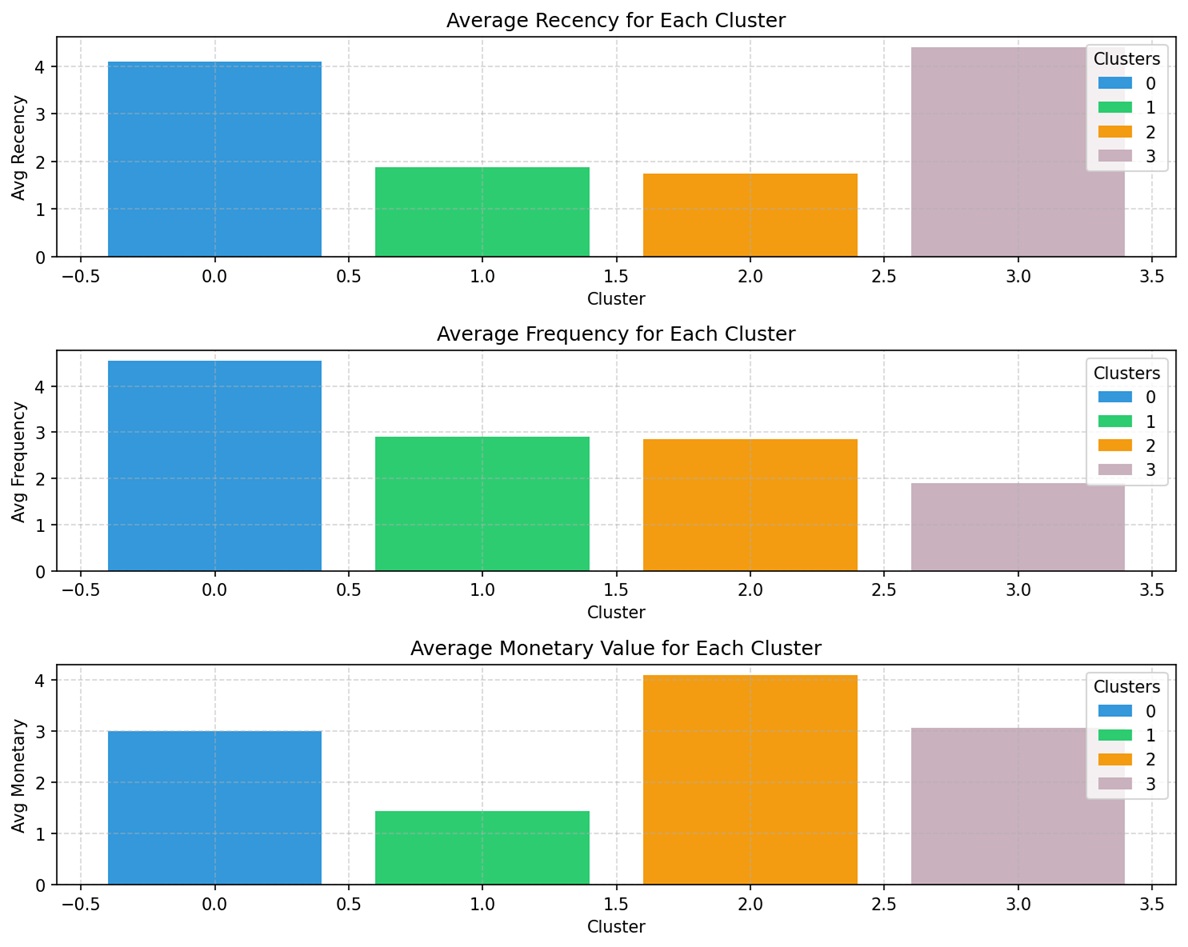
We applied RFM (Recency, Frequency, Monetary) analysis and K-Means clustering for customer segmentation. Key insights include:
- Customers with higher recency scores tend to spend more, though the pattern is not strictly linear.
- Customers with moderate to high frequency also tend to be higher spenders, though not always.
The clustering produced four distinct segments:
- Loyal Moderate Spenders
- At-Risk Low Spenders
- High-Value Dormant
- New/Recent Customers
| Cluster |
Suggested Segment |
Characteristics |
Suggested Action |
| 0 |
Loyal Moderate Spenders |
Recent, frequent, moderate spend |
Upselling, loyalty programs |
| 1 |
At-Risk Low Spenders |
Inactive, moderate past interaction, low spend |
Reactivation campaigns |
| 2 |
High-Value Dormant |
Inactive, some past interaction, high spend |
High-priority win-back |
| 3 |
New/Recent Customers |
Very recent, low interaction, moderate spend |
Nurturing and engagement |
We asked: Do churn rates align with these segments? After analysis, we found that the segmentation holds well overall. However, Cluster 2 would be better labeled as High-Value Steady Customers to reflect their consistent behavior and value.
Recommended Strategies by Segment:
| Cluster |
Adjusted Segment Name |
Characteristics |
Business Strategy |
| 0 |
Loyal Moderate Spenders |
Recent, frequent, moderate spend, low churn |
Retention & Upselling: Loyalty rewards, personalized offers to increase spend, referral incentives |
| 1 |
At-Risk Low Spenders |
Inactive, moderate past interaction, higher churn |
Reactivation Campaigns: Targeted discounts, reminders, win-back emails, understand reasons for churn |
| 2 |
High-Value Steady Customers |
Moderate activity, high spend, low churn |
Protect & Reward: VIP treatment, premium support, early access to offers, prevent churn at all costs |
| 3 |
New/Uncertain Customers |
Recent interaction, low interaction frequency, moderate churn |
Onboarding & Engagement: Educational content, welcome offers, early satisfaction surveys to build loyalty |
I also use Power BI to show KPIs and some analysis.
View KPI Dashboard
NLP
Genderizer
The spanish-name-genderizer is a Python package designed to determine the gender of names, especially Spanish ones. It is useful in various fields: Demographic Analysis (for gender-based insights), HR and Diversity Analytics (gender diversity evaluation), Sentiment Analysis (customer feedback segmentation by gender), Marketing and Customer Segmentation, Healthcare Analytics, Epidemiology, and more. This tool fills a gap in pipelines requiring gender analysis where explicit gender data is missing.
The spanish-name-genderizer package uses a neural network trained on extensive name databases, achieving 95% accuracy.
To install the library:
pip install spanish-name-genderizer
How to use:
genderizer = SpanishNameGenderizer()
print(genderizer.genderize("Juan-Carlos"))
This will return "male" as output.
LLM

DeepQuery
At IESE Business School, my extensive research demands, stemming from my master's thesis and extending into my professional tasks, led me to develop DeepQuery. This tool optimizes the extraction and retrieval of information from web content, particularly addressing areas not covered by ChatGPT's initial training.
DeepQuery tackles the challenge of large text volumes by using a "RecursiveCharacterTextSplitter" to manage and overlap text chunks, maintaining context continuity. The text is processed using OpenAI embeddings, and the data vectors are stored in a FAISS vector database for efficient future access. Ultimately, DeepQuery delivers precise answers from the indexed content, greatly reducing research time and improving data accuracy.
NLP

Automated feature extraction from merger documents: Novel approches using LLMs
Nowadays, data comes in various forms, and text data is just as critical, if not more so, as numerical data. The challenge we faced was devising a solution for legal practitioners who constantly engage in document research and reading. We sourced our data from the European Commission's website, performed an analysis, and developed unique features based on the data obtained.
We introduced an innovative technique for analyzing and extracting entities from PDF documents and created a knowledge-based chatbot for user interaction. Additionally, we conducted a comprehensive assessment to evaluate the accuracy of our models.
P.S: The project mentioned above is subject to a Non-Disclosure Agreement (NDA), therefore the code cannot be shared. However, feel free to reach out if further information is needed.
Classification

Predicting patient mortality
Doctors and medical practitioners frequently face life-or-death decisions based on a patient's medical condition upon arrival at the hospital. In this project, we used the MIMIC-III (Medical Information Mart for Intensive Care III) dataset to develop a predictive model that estimates the probability of patient mortality within a specific timeframe. This tool aims to aid medical professionals in risk stratification, thereby facilitating more informed clinical decision-making.
A predictive model was created using K-Nearest Neighbor and SVM algorithms and achieved an accuracy rate of 0.88.
Classification
Predicting patients' length of hospital stay
Several factors can contribute to an extended length of stay for patients, such as comorbidities, severity of illness, chronic conditions, and the need for specialized treatment. Understanding the duration of a patient's stay can improve the efficiency of patient admissions.
In this project, we used both the MIMIC dataset and the Morbidities dataset to develop our predictive model. Techniques employed included decision trees, ensemble methods, and neural networks.
OOP

Pipeline for E-commerce Customer Attrition
A high customer churn rate poses a significant challenge for businesses, making it crucial to discover ways to retain customers. The aim of this project was to develop a pipeline that could analyze data from an e-commerce site and predict the likelihood of customer churn.
Forecasting

Forecasting order volumes for Glovo
Centered around the forecasting of weekly orders, the project utilized data from Glovo. Features such as days of the week, months, and seasons were generated for enhanced analysis. An Exploratory Data Analysis (EDA) was conducted to identify trends, revealing a notable daily pattern, and outliers were examined for a more comprehensive understanding of the data. Upon the data being found to be stationary, the transition to the modeling phase was made. The SARIMA model was employed for its exceptional capacity to handle seasonality, resulting in predictions of high accuracy.
About
I was born in Enugu, Nigeria and studied Mechanical Engineering in Moscow, where I graduated with a perfect score in my masters program. Along the way, I became fluent in Russian and picked up a bit of French. I've had the privilege of working in several engineering firms in Moscow.
I taught myself HTML, CSS, and Javascript just to test myself, and worked on website building as a side project. But I didn't stop there - I wanted to explore further, and so I embarked on a journey into the world of Data Science. After over one year of sleepless nights and countless hours of studying at the Barcelona School of Economics, I emerged as a Data Scientist, thus beginning a new chapter in my professional life. During my time at the Barcelona School of Economics, I gained knowledge and experience from the numerous real-world projects ranging from running simple linear regressions, classification tasks, decision tree tasks to applying GPT API, Langchain, NLP models in several fields.
I have a deep love for football, basketball, snowboarding, and camping. Interestingly, I picked up snowboarding and camping during my time in Russia. As far as I know, I may be the first Nigerian to have snowboarded from the top of Mount Elbrus and to have hiked up some active volcanoes in Kamchatka. Interestingly, being chased up a tree by a chicken when I was 5 might have fueled my determination to always strive for more and better.
Contact
Elements
Text
This is bold and this is strong. This is italic and this is emphasized.
This is superscript text and this is subscript text.
This is underlined and this is code: for (;;) { ... }. Finally, this is a link.
Heading Level 2
Heading Level 3
Heading Level 4
Heading Level 5
Heading Level 6
Blockquote
Fringilla nisl. Donec accumsan interdum nisi, quis tincidunt felis sagittis eget tempus euismod. Vestibulum ante ipsum primis in faucibus vestibulum. Blandit adipiscing eu felis iaculis volutpat ac adipiscing accumsan faucibus. Vestibulum ante ipsum primis in faucibus lorem ipsum dolor sit amet nullam adipiscing eu felis.
Preformatted
i = 0;

while (!deck.isInOrder()) {
    print 'Iteration ' + i;
    deck.shuffle();
    i++;
}

print 'It took ' + i + ' iterations to sort the deck.';
Lists
Unordered
- Dolor pulvinar etiam.
- Sagittis adipiscing.
- Felis enim feugiat.
Alternate
- Dolor pulvinar etiam.
- Sagittis adipiscing.
- Felis enim feugiat.
Ordered
- Dolor pulvinar etiam.
- Etiam vel felis viverra.
- Felis enim feugiat.
- Dolor pulvinar etiam.
- Etiam vel felis lorem.
- Felis enim et feugiat.
Icons
Actions
Table
Default
| Name |
Description |
Price |
| Item One |
Ante turpis integer aliquet porttitor. |
29.99 |
| Item Two |
Vis ac commodo adipiscing arcu aliquet. |
19.99 |
| Item Three |
Morbi faucibus arcu accumsan lorem. |
29.99 |
| Item Four |
Vitae integer tempus condimentum. |
19.99 |
| Item Five |
Ante turpis integer aliquet porttitor. |
29.99 |
|
100.00 |
Alternate
| Name |
Description |
Price |
| Item One |
Ante turpis integer aliquet porttitor. |
29.99 |
| Item Two |
Vis ac commodo adipiscing arcu aliquet. |
19.99 |
| Item Three |
Morbi faucibus arcu accumsan lorem. |
29.99 |
| Item Four |
Vitae integer tempus condimentum. |
19.99 |
| Item Five |
Ante turpis integer aliquet porttitor. |
29.99 |
|
100.00 |